日志分析工具
日志分析
日志分析工具介绍
tools/analysis_tools/analyze_logs.py 脚本绘制指定键值的变化曲线。
python tools/analysis_tools/analyze_logs.py plot_curve  \
    ${JSON_LOGS}  \
    [--keys ${KEYS}]  \
    [--title ${TITLE}]  \
    [--legend ${LEGEND}]  \
    [--backend ${BACKEND}]  \
    [--style ${STYLE}]  \
    [--out ${OUT_FILE}]  \
    [--window-size ${WINDOW_SIZE}]
所有参数的说明:
json_logs: 模型配置文件的路径(可同时传入多个,使用空格分开)。--keys: 分析日志的关键字段,数量为len(${JSON_LOGS}) * len(${KEYS})默认为 ‘loss’。--title: 分析日志的图片名称,默认使用配置文件名, 默认为空。--legend: 图例的名称,其数目必须与相等len(${JSON_LOGS}) * len(${KEYS})。 默认使用"${JSON_LOG}-${KEYS}".--backend: matplotlib 的绘图后端,默认由 matplotlib 自动选择。--style: 绘图配色风格,默认为whitegrid。--out: 保存分析图片的路径,如不指定则不保存。--window-size: 可视化窗口大小,如果没有指定,默认为'12*7'。如果需要指定,需按照格式'W*H'。
Note
The --style option depends on seaborn package, please install it before setting it.
如何或绘制损失/精度曲线
我们将给出一些示例,来展示如何使用 tools/analysis_tools/analyze_logs.py脚本绘制精度曲线的损失曲线
绘制某日志文件对应的损失曲线图
python tools/analysis_tools/analyze_logs.py plot_curve your_log_json --keys loss --legend loss
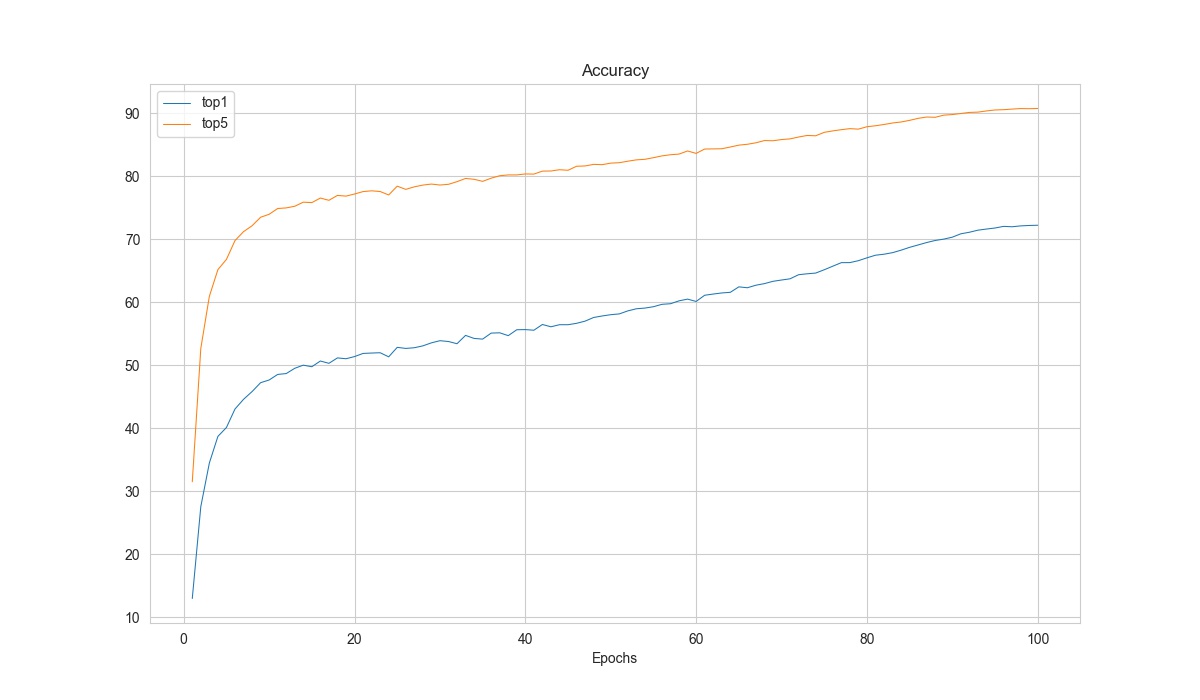
绘制某日志文件对应的 top-1 和 top-5 准确率曲线图,并将曲线图导出为 results.jpg 文件。
python tools/analysis_tools/analyze_logs.py plot_curve your_log_json --keys accuracy/top1 accuracy/top5 --legend top1 top5 --out results.jpg
在同一图像内绘制两份日志文件对应的 top-1 准确率曲线图。
python tools/analysis_tools/analyze_logs.py plot_curve log1.json log2.json --keys accuracy/top1 --legend exp1 exp2
如何统计训练时间
tools/analysis_tools/analyze_logs.py 也可以根据日志文件统计训练耗时。
python tools/analysis_tools/analyze_logs.py cal_train_time \
    ${JSON_LOGS}
    [--include-outliers]
所有参数的说明:
json_logs:模型配置文件的路径(可同时传入多个,使用空格分开)。--include-outliers:如果指定,将不会排除每个轮次中第一个时间记录(有时第一轮迭代会耗时较长)。
示例:
python tools/analysis_tools/analyze_logs.py cal_train_time work_dirs/your_exp/20230206_181002/vis_data/scalars.json
预计输出结果如下所示:
-----Analyze train time of work_dirs/your_exp/20230206_181002/vis_data/scalars.json-----
slowest epoch 68, average time is 0.3818
fastest epoch 1, average time is 0.3694
time std over epochs is 0.0020
average iter time: 0.3777 s/iter
结果分析
利用 tools/test.py 的--out,我们可以将所有的样本的推理结果保存到输出文件中。利用这一文件,我们可以进行进一步的分析。
如何进行离线度量评估
我们提供了 tools/analysis_tools/eval_metric.py 脚本,使用户能够根据预测文件评估模型。
python tools/analysis_tools/eval_metric.py \
      ${RESULT} \
      [--metric ${METRIC_OPTIONS} ...]
所有参数说明:
result:tools/test.py输出的结果文件。--metric:用于评估结果的指标,请至少指定一个指标,并且你可以通过指定多个--metric来同时计算多个指标。
请参考评估文档选择可用的评估指标和对应的选项。
Note
在 tools/test.py 中,我们支持使用 --out-item 选项来选择保存何种结果至输出文件。
请确保没有额外指定 --out-item,或指定了 --out-item=pred。
示例:
# 获取结果文件
python tools/test.py configs/resnet/resnet18_8xb16_cifar10.py \
    https://download.openmmlab.com/mmclassification/v0/resnet/resnet18_b16x8_cifar10_20210528-bd6371c8.pth \
    --out results.pkl

# 计算 top-1 和 top-5 准确率
python tools/analysis_tools/eval_metric.py results.pkl --metric type=Accuracy topk=1,5

# 计算总体准确率,各个类别上的精确度、召回率、F1-score
python tools/analysis_tools/eval_metric.py results.pkl --metric type=Accuracy \
    --metric type=SingleLabelMetric items=precision,recall,f1-score average=None
如何绘制测试结果的混淆矩阵
我们提供 tools/analysis_tools/confusion_matrix.py,帮助用户能够从测试输出文件中绘制混淆矩阵。
python tools/analysis_tools/confusion_matrix.py \
      ${CONFIG} \
      ${RESULT} \
      [--out ${OUT}] \
      [--show] \
      [--show-path ${SHOW_PATH}] \
      [--include-values] \
      [--cmap] \
      [--cfg-options ${CFG_OPTIONS} ...] \
所有参数说明:
config:配置文件的路径。result:tools/test.py的输出结果文件,或是模型权重文件。--out:将混淆矩阵保存到指定路径下的 pickle 文件中。--show:是否可视化混淆矩阵图。--show-path:将可视化混淆矩阵图保存到指定路径下。--include-values:是否在可视化混淆矩阵图中显示具体值。--cmap:用以可视化混淆矩阵的颜色配置。--cfg-options:额外的配置选项,会被合入配置文件,参考学习配置文件。
Note
在 tools/test.py 中,我们支持使用 --out-item 选项来选择保存何种结果至输出文件。
请确保没有额外指定 --out-item,或指定了 --out-item=pred。
Examples:
# 获取结果文件
python tools/test.py configs/resnet/resnet18_8xb16_cifar10.py \
    https://download.openmmlab.com/mmclassification/v0/resnet/resnet18_b16x8_cifar10_20210528-bd6371c8.pth \
    --out results.pkl

# 将混淆矩阵计算结果保存至 cm.pkl 中
python tools/analysis_tools/confusion_matrix.py configs/resnet/resnet18_8xb16_cifar10.py results.pkl --out cm.pkl

# 可视化混淆矩阵图,并在图形窗口显示
python tools/analysis_tools/confusion_matrix.py configs/resnet/resnet18_8xb16_cifar10.py results.pkl --show
如何将预测结果可视化
我们可以使用脚本 tools/analysis_tools/analyze_results.py 来保存预测成功或失败时得分最高的图像。
python tools/analysis_tools/analyze_results.py \
      ${CONFIG} \
      ${RESULT} \
      [--out-dir ${OUT_DIR}] \
      [--topk ${TOPK}] \
      [--rescale-factor ${RESCALE_FACTOR}] \
      [--cfg-options ${CFG_OPTIONS}]
所有参数说明::
config:配置文件的路径。result:tools/test.py的输出结果文件。--out_dir:保存结果分析的文件夹路径。--topk:分别保存多少张预测成功/失败的图像。如果不指定,默认为20。--rescale-factor:图像的缩放系数,如果样本图像过大或过小时可以使用(过小的图像可能导致结果标签非常模糊)。--cfg-options:额外的配置选项,会被合入配置文件,参考学习配置文件。
Note
在 tools/test.py 中,我们支持使用 --out-item 选项来选择保存何种结果至输出文件。
请确保没有额外指定 --out-item,或指定了 --out-item=pred。
示例:
# 获取预测结果文件
python tools/test.py configs/resnet/resnet18_8xb16_cifar10.py \
    https://download.openmmlab.com/mmclassification/v0/resnet/resnet18_b16x8_cifar10_20210528-bd6371c8.pth \
    --out results.pkl

# 保存预测成功/失败的图像中,得分最高的前 10 张,并在可视化时将输出图像放大 10 倍。
python tools/analysis_tools/analyze_results.py \
       configs/resnet/resnet18_8xb16_cifar10.py \
       results.pkl \
       --out-dir output \
       --topk 10 \
       --rescale-factor 10